Move plot 3
moveplot3.RdCreate animated biplot on samples and variables in a biplot with a given target
Arguments
- bp
biplot object from biplotEZ
- time.var
time variable
- group.var
group variable
- move
whether to animate (TRUE) or facet (FALSE) samples and variables, according to time.var
- hulls
whether to display sample points or convex hulls
- scale.var
scaling the vectors representing the variables
- target
Target data set to which all biplots should be matched consisting of the the same dimensions. If not specified, the centroid of all available biplot sample coordinates from
time.varwill be used. DefaultNULL.
Value
- bp
Returns the elements of the biplot object
bpfrombiplotEZ.- iter_levels
The levels of the time variable.
- coord_set
The coordinates of the configurations before applying Generalised Orthogonal Procrustes Analysis.
- GPA_list
The coordinates of the configurations after applying Generalised Orthogonal Procrustes Analysis.
- plot
An animated or a facet of biplots based on the dynamic frame.
Examples
data(Africa_climate)
data(Africa_climate_target)
bp <- biplot(Africa_climate, scaled = TRUE) |> PCA()
bp |> moveplot3(time.var = "Year", group.var = "Region", hulls = TRUE,
move = FALSE, target = NULL)
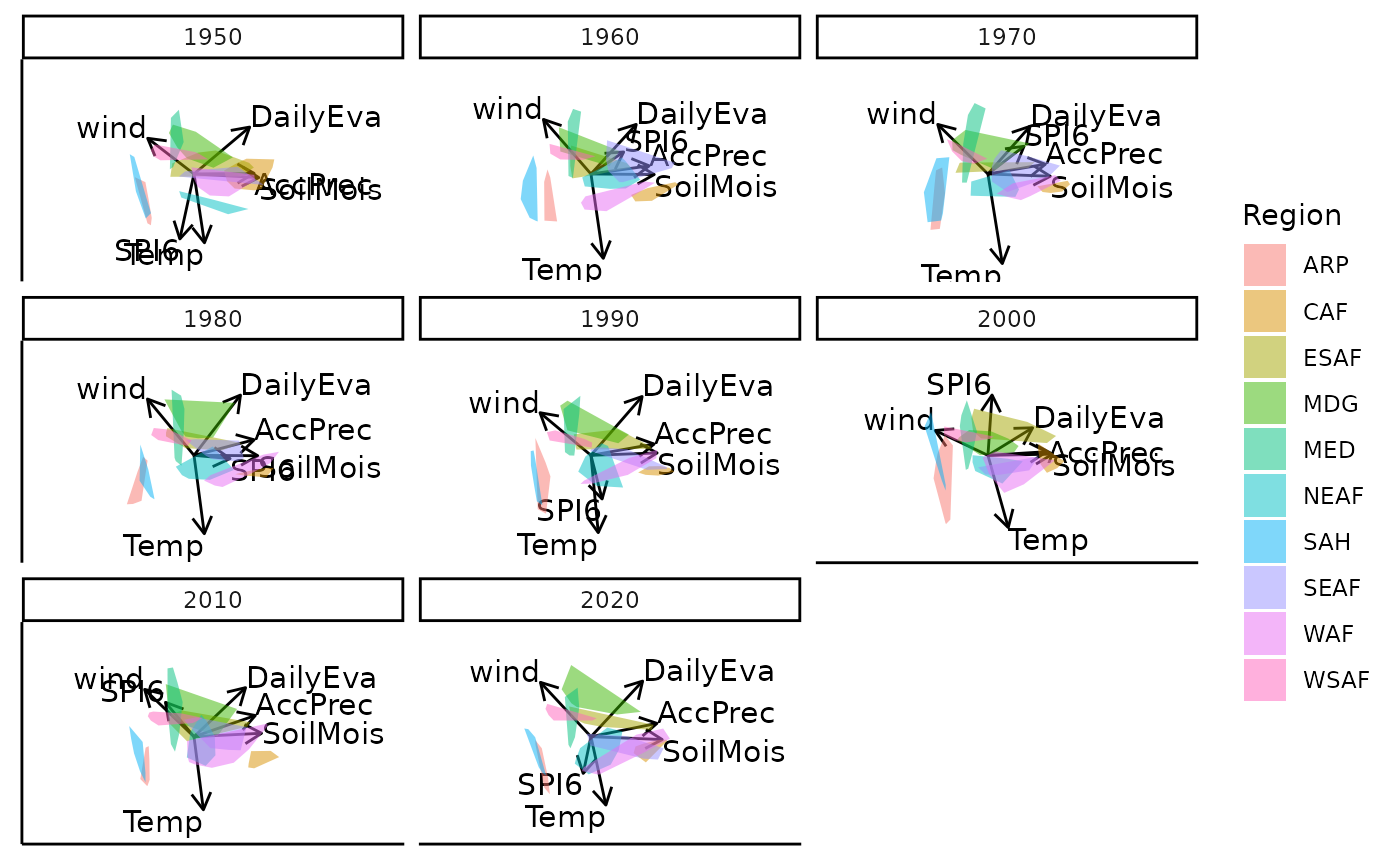 #> Object of class biplot, based on 960 samples and 9 variables.
#> 6 numeric variables.
#> 3 categorical variables.
# \donttest{
if(interactive()) {
bp |> moveplot3(time.var = "Year", group.var = "Region", hulls = TRUE,
move = TRUE, target = NULL)}# }
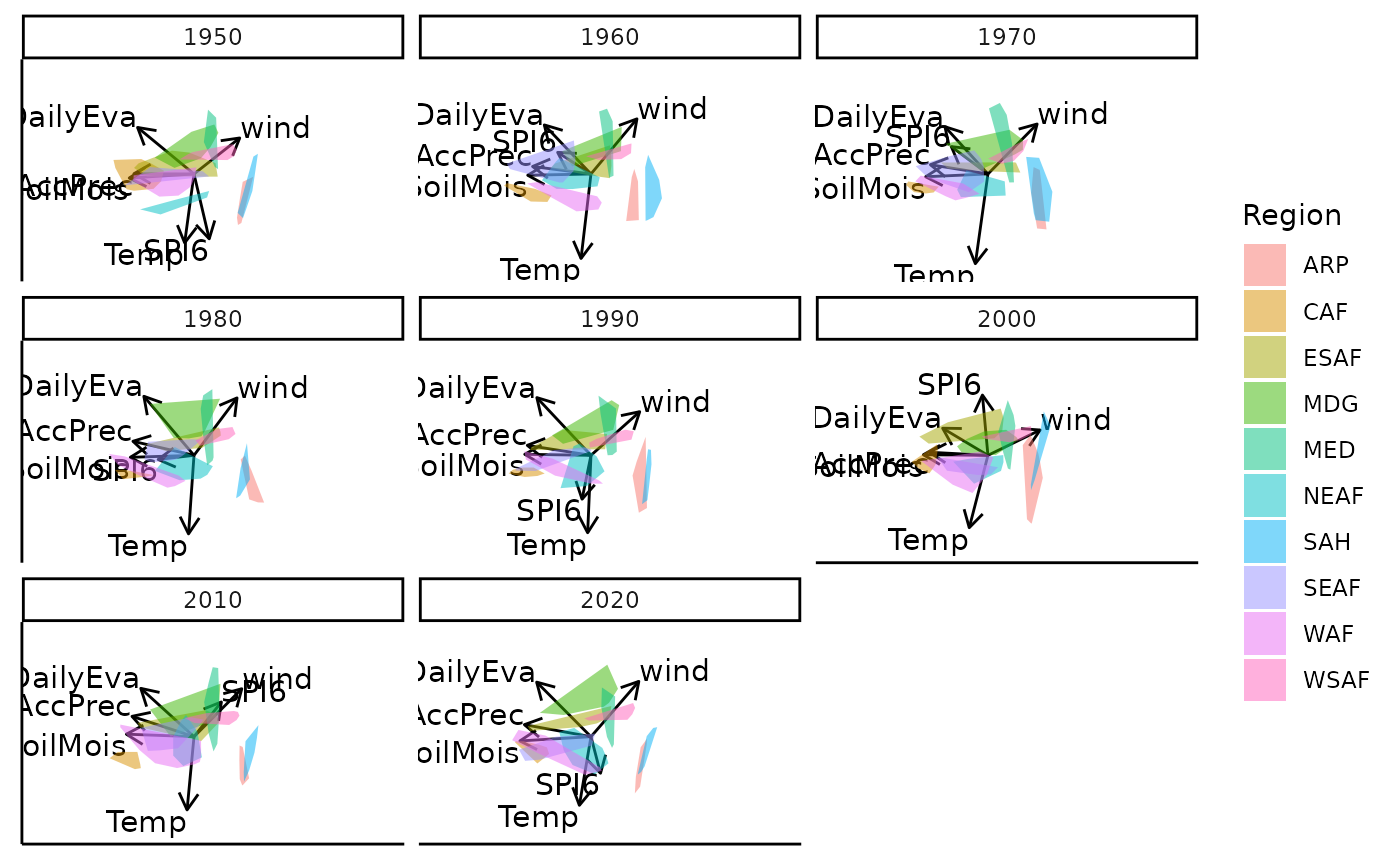
bp |> moveplot3(time.var = "Year", group.var = "Region", hulls = TRUE,
move = FALSE, target = Africa_climate_target)
#> Object of class biplot, based on 960 samples and 9 variables.
#> 6 numeric variables.
#> 3 categorical variables.
# \donttest{
if(interactive()) {
bp |> moveplot3(time.var = "Year", group.var = "Region", hulls = TRUE,
move = TRUE, target = NULL)}# }
bp |> moveplot3(time.var = "Year", group.var = "Region", hulls = TRUE,
move = FALSE, target = Africa_climate_target)
 #> Object of class biplot, based on 960 samples and 9 variables.
#> 6 numeric variables.
#> 3 categorical variables.
#> Object of class biplot, based on 960 samples and 9 variables.
#> 6 numeric variables.
#> 3 categorical variables.