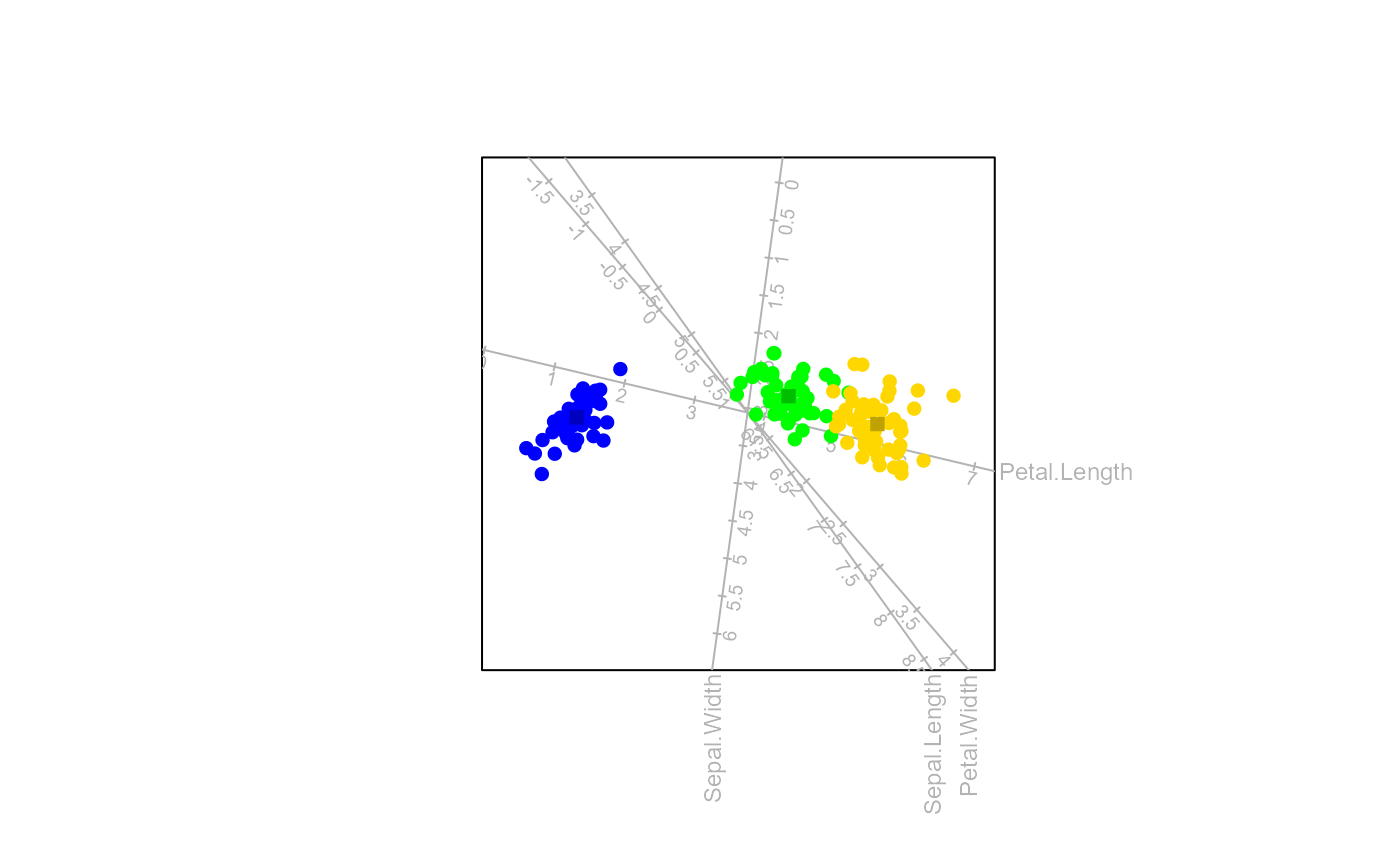
Perform Canonical Variate Analysis (CVA)
CVA.RdThis function appends the biplot object with elements resulting from performing CVA.
Arguments
- bp
an object of class
biplotobtained from preceding functionbiplot().- classes
a vector of the same length as the number of rows in the data matrix with the class indicator for the samples.
- dim.biplot
the dimension of the biplot. Only values
1,2and3are accepted, with default2.- e.vects
the vector indicating which eigenvectors (canonical variates) should be plotted in the biplot, with default
1:dim.biplot.- weightedCVA
a character string indicating which type of CVA to perform. One of "
weighted" (default) for a weighted CVA to be performed (The centring matrix will be a diagonal matrix with the class sizes (\(\mathbf{C} = \mathbf{N}\)), "unweightedCent" for unweighted CVA to be performed (The centring matrix is the usual centring matrix (\(\mathbf{C} = \mathbf{I}_{G} - G^{-1}\mathbf{1}_{G}\mathbf{1}_{G}'\))) or "unweightedI" for unweighted CVA to be performed while retaining the weighted centroid (The centring matrix is an indicator matrix (\(\mathbf{C} = \mathbf{I}_{G}\))).- show.class.means
a logical value indicating whether to plot the class means on the biplot.
- low.dim
a character string indicating which method to use to construct additional dimension(s) if the dimension of the canonical space is smaller than
dim.biplot. One of "sample.opt" (default) for maximising the sample predictivity of the individual samples in the biplot or "Bhattacharyya.dist" which is based on the decomposition of the Bhattacharyya distance into a component for the sample means and a component for the dissimilarity between the sample covariance matrices.
Value
Object of class CVA with the following elements:
- X
the matrix of the centered and scaled numeric variables.
- Xcat
the data frame of the categorical variables.
- raw.X
the original data.
- classes
the vector of category levels for the class variable. This is to be used for
colour,pchandcexspecifications.- na.action
the vector of observations that have been removed.
- center
a logical value indicating whether \(\mathbf{X}\) is centered.
- scaled
a logical value indicating whether \(\mathbf{X}\) is scaled.
- means
the vector of means for each numerical variable.
- sd
the vector of standard deviations for each numerical variable.
- n
the number of observations.
- p
the number of variables.
- group.aes
the vector of category levels for the grouping variable. This is to be used for
colour,pchandcexspecifications.- g.names
the descriptive names to be used for group labels.
- g
the number of groups.
- Title
the title of the biplot rendered.
- Lmat
the matrix for transformation to the canonical space.
- Linv
the inverse of \(\mathbf{L}\).
- eigenvalues
the vector of eigenvalues of the two-sided eigenvalue problem.
- Z
the matrix with each row containing the details of the points to be plotted (i.e. coordinates).
- ax.one.unit
one unit in the positive direction of each biplot axis.
- Gmat
the indicator matrix defining membership of the classes.
- Xmeans
the matrix of the class means.
- Zmeans
the matrix of the class mean coordinates that are plotted in the biplot.
- e.vects
the vector indicating which canonical variates are plotted in the biplot.
- Cmat
the centring matrix based on different choices of weighting described in arguments.
- Bmat
the between class sums of squares and cross products matrix.
- Wmat
the within class sums of squares and cross products matrix.
- Mrr
the matrix used for prediction from the canonical space (the inverse of \(\mathbf{M}=\mathbf{LV})\).
- Mr
the first r dimensions of the solution to be plotted.
- Nmat
the matrix with the class sizes on the diagonal.
- lambda.mat
the matrix with the eigenvalues of \(\mathbf{W}^{-1/2}\mathbf{BW}^{-1/2}\) on the diagonal.
- class.means
a logical value indicating whether the class means should be plotted in the biplot.
- dim.biplot
the dimension of the biplot.
- low.dim
the method used to construct additional dimension(s).
