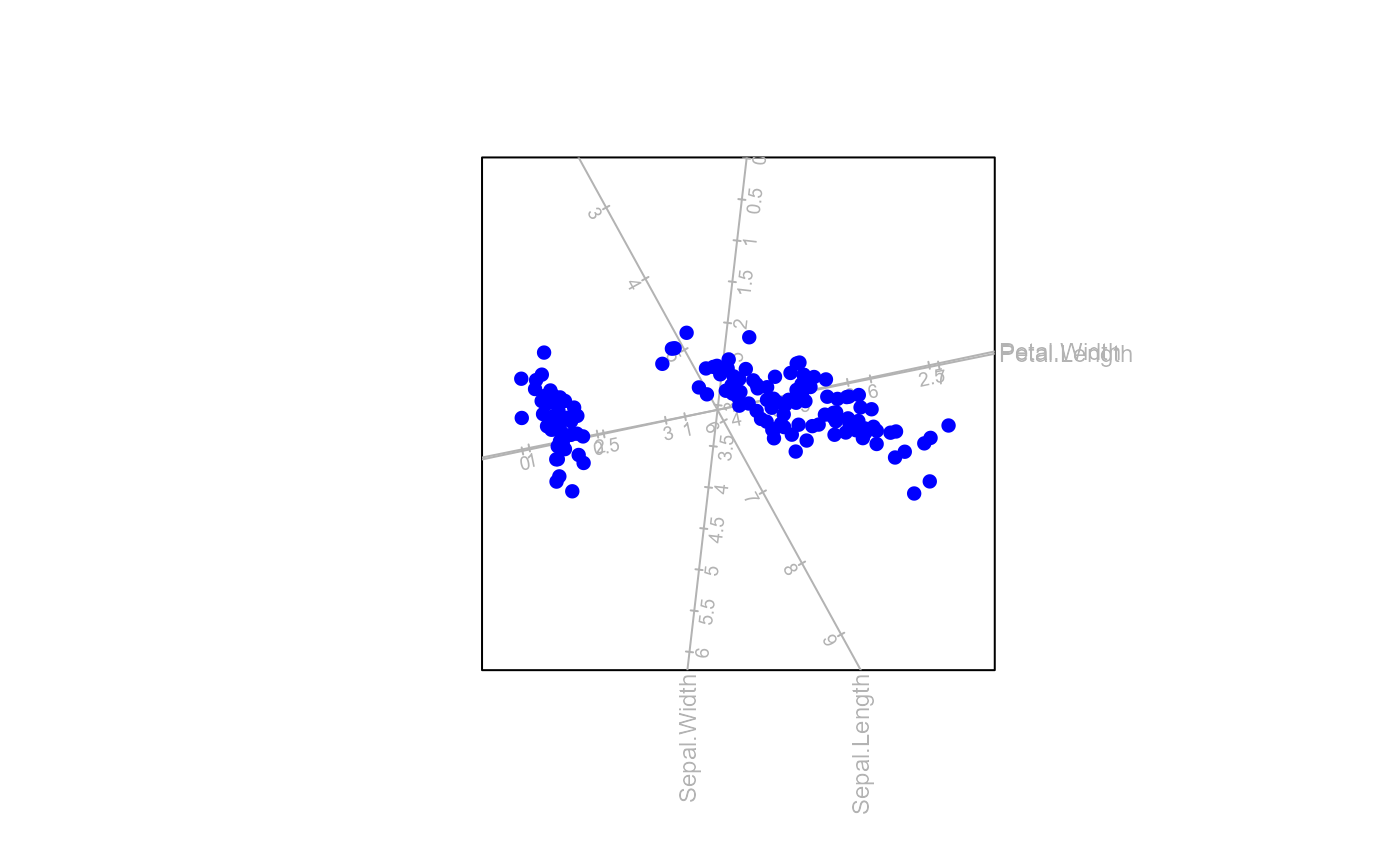
Perform Principal Components Analysis (PCA)
PCA.RdThis function appends the biplot object with elements resulting from performing PCA.
Arguments
- bp
an object of class
biplotobtained from preceding functionbiplot().- dim.biplot
the dimension of the biplot. Only values
1,2and3are accepted, with default2.- e.vects
the vector indicating which eigenvectors (principal components) should be plotted in the biplot, with default
1:dim.biplot.- group.aes
a vector of the same length as the number of rows in the data matrix for differentiated aesthetics for samples.
- show.class.means
a logical value indicating whether group means should be plotted in the biplot.
- correlation.biplot
a logical value. If
FALSE, the distances between sample points are optimally approximated in the biplot. IfTRUE, the correlations between variables are optimally approximated by the cosine of the angles between axes. Default isFALSE.
Value
An object of class PCA with the following elements:
- X
the matrix of the centered and scaled numeric variables.
- Xcat
the data frame of the categorical variables.
- raw.X
the original data.
- classes
the vector of category levels for the class variable. This is to be used for
colour,pchandcexspecifications.- na.action
the vector of observations that have been removed.
- center
a logical value indicating whether \(\mathbf{X}\) is centered.
- scaled
a logical value indicating whether \(\mathbf{X}\) is scaled.
- means
the vector of means for each numerical variable.
- sd
the vector of standard deviations for each numerical variable.
- n
the number of observations.
- p
the number of variables.
- group.aes
the vector of category levels for the grouping variable. This is to be used for
colour,pchandcexspecification.- g.names
the descriptive names to be used for group labels.
- g
the number of groups.
- Title
the title of the biplot rendered.
- Z
the matrix with each row containing the details of the points that are plotted (i.e. coordinates).
- Lmat
the matrix for transformation to the principal components.
- Linv
the inverse of \(\mathbf{L}\).
- eigenvalues
the vector of eigenvalues of the covariance matrix of \(\mathbf{X}\).
- ax.one.unit
one unit in the positive direction of each biplot axis.
- e.vects
the vector indicating which principal components are plotted in the biplot.
- Vr
the
1:dim.biplotcolumns of \(\mathbf{V}\).- dim.biplot
the dimension of the biplot.
- class.means
a logical value indicating whether group means are plotted in the biplot.
- Zmeans
the matrix of class mean coordinates that are plotted in the biplot.
References
Gabriel, K.R. (1971) The biplot graphic display of matrices with application to principal component analysis. Biometrika. 58(3):453–467.
