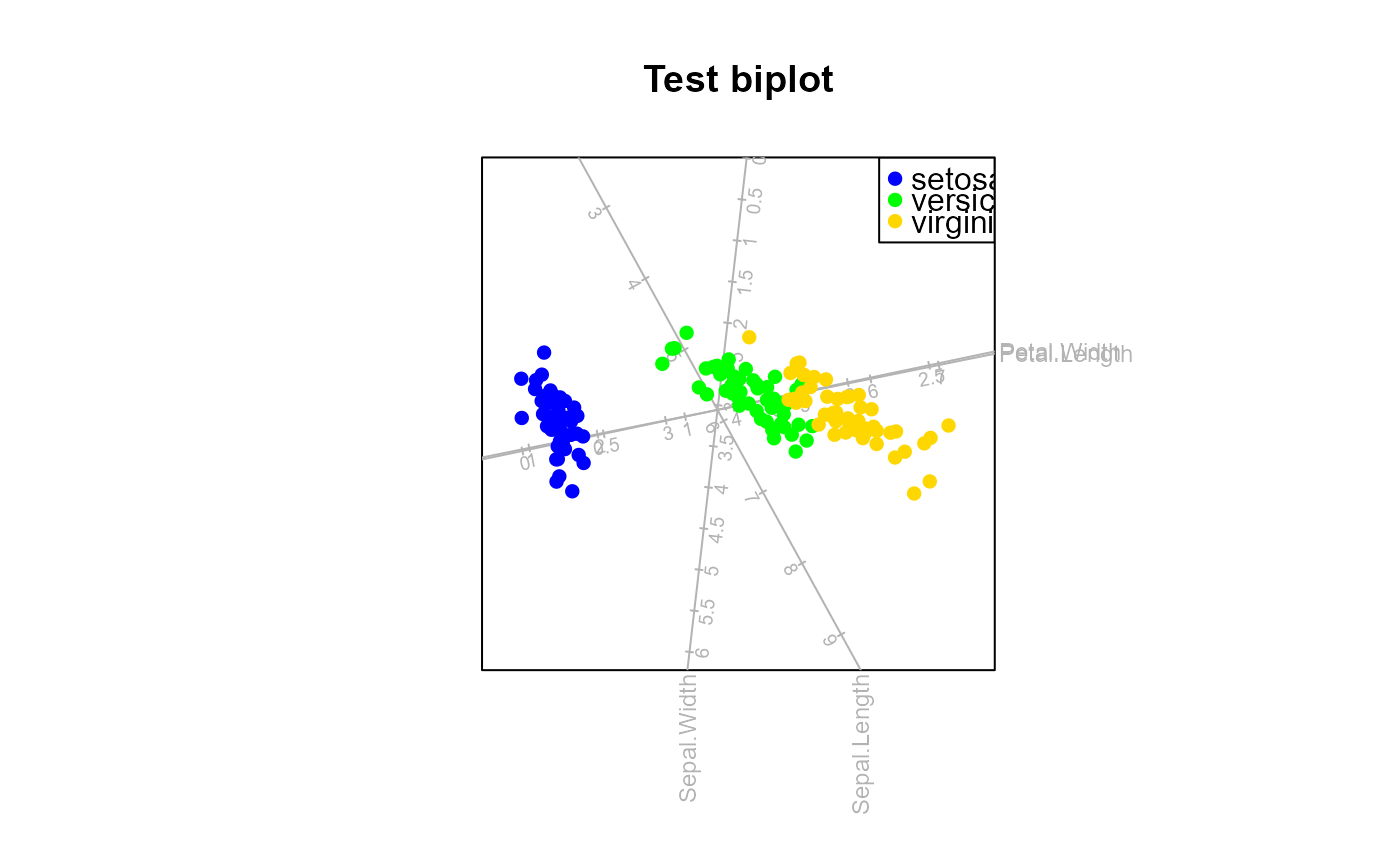
Format the legend for the biplot
legend.type.RdThis function enables the user to format the legend and make a required selection to display.
Usage
legend.type(bp, samples = FALSE, means = FALSE, bags = FALSE,
                   ellipses=FALSE,regions=FALSE, new=FALSE, ...)
Arguments
- bp
an object of class
biplot.- samples
a logical value indicating whether a legend should be printed for samples, with default
FALSE.- means
a logical value indicating whether a legend should be printed for means, with default
FALSE.- bags
a logical value indicating whether a legend should be printed for bags, with default
FALSE.- ellipses
a logical value indicating whether a legend should be printed for concentration ellipses, with default
FALSE.- regions
a logical value indicating whether a legend should be printed for classification regions, with default
FALSE.- new
a logical value indicating whether the legend should appear in a new window, with default
FALSE.- ...
additional arguments to be sent to
legend().
Value
A list with the following components is available:
- samples
a logical value indicating whether a legend for samples are provided.
- means
a logical value indicating whether a legend for class means are provided.
- bags
a logical value indicating whether a legend for \(\alpha\)-bags are provided.
- ellipses
a logical value indicating whether a legend for \(\kappa\)-ellipses are provided.
- regions
a logical value indicating whether a legend for classification regions are provided.
- new
a logical value indicating whether the legend appears on new plot.