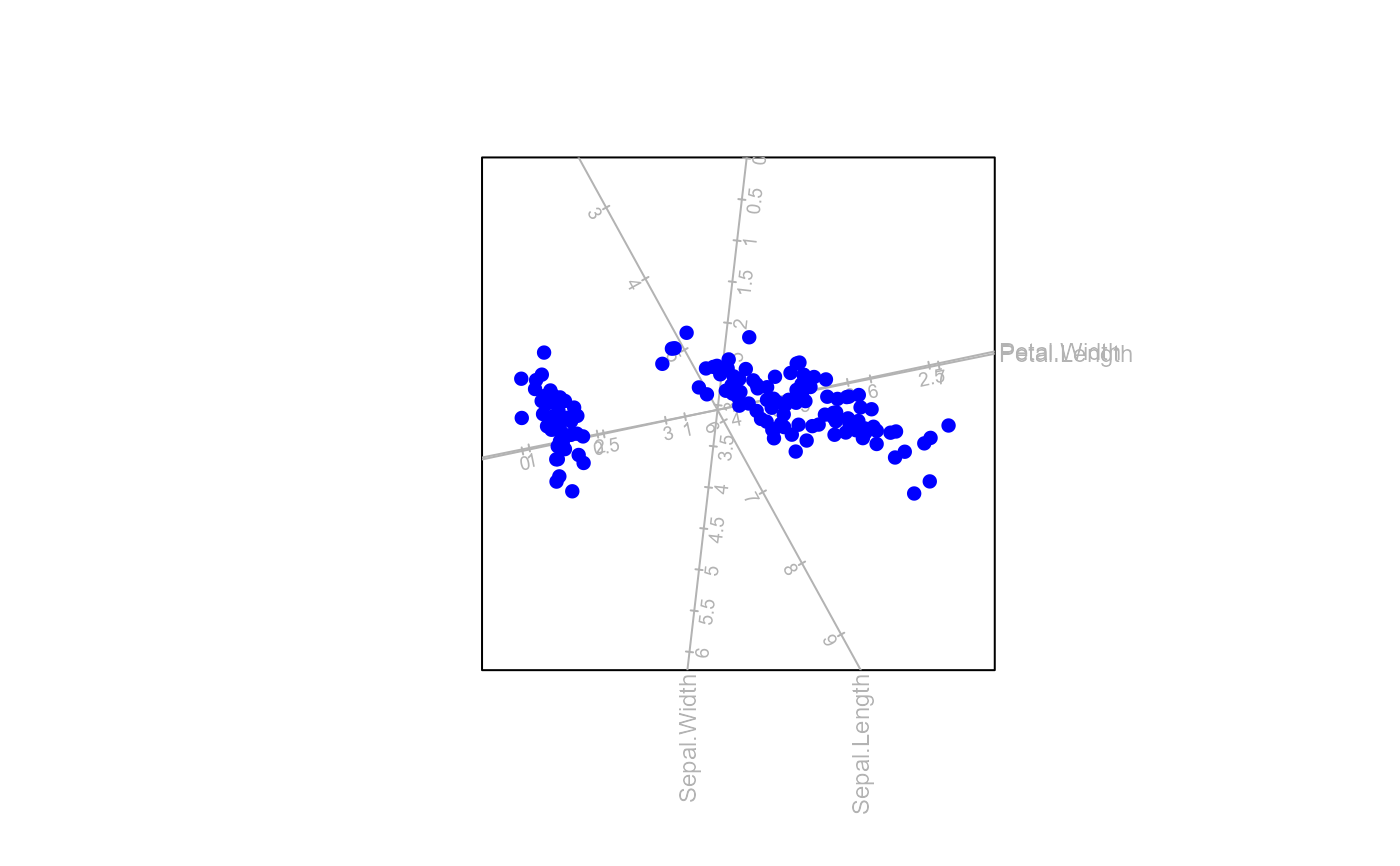
Format aesthetics for the class or group means
means.RdThis function allows the user to format the aesthetics for the class means or group means.
Usage
means (bp,  which = NULL, col = NULL, pch = 15, cex = 1, label = FALSE,
label.col = NULL,label.cex = 0.75, label.side = "bottom", label.offset = 0.5,
opacity = 1, shade.darker = TRUE)
Arguments
- bp
an object of class
biplot.- which
a vector containing the groups or classes for which the means should be displayed, with default
bp$g.- col
the colour(s) for the means, with default as the colour of the samples.
- pch
the plotting character(s) for the means, with default
15.- cex
the character expansion(s) for the means, with default
1.- label
a logical value indicating whether the means should be labelled, with default
TRUE.- label.col
a vector of the same length as
whichwith label colours for the means, with default as the colour of the means.- label.cex
a vector of the same length as
whichwith label text expansions for the means, with default0.75.- label.side
the side at which the label of the plotted mean point appears, with default
bottom. Note that unlike the argumentposintext(), options are "bottom", "left", "top", "right" and not1,2,3,4.- label.offset
the offset of the label from the plotted mean point. See
?textfor a detailed explanation of the argumentoffset.- opacity
transparency of means.
- shade.darker
a logical value indicating whether the colour of the mean points should be made a shade darker than the default or specified colour, with default
TRUE.
Value
The object of class biplot will be appended with a list called means containing the following elements:
- which
a vector containing the groups or classes for which the means are displayed.
- col
the colour(s) of the means.
- pch
the plotting character(s) of the means.
- cex
the character expansion(s) of the plotting character(s) of the means.
- label
a logical value indicating whether means are labelled.
- label.col
the label colours of the means.
- label.cex
the label text expansions of the samples.
- label.side
the side at which the label of the plotted mean point appears.
- label.offset
the offset of the label from the plotted mean point.
- opacity
the opacity level of the plotted points.
Details
The number of classes or groups (defined by group.aes) is indicated as g. If an argument is not of length g,
recycling is used.
