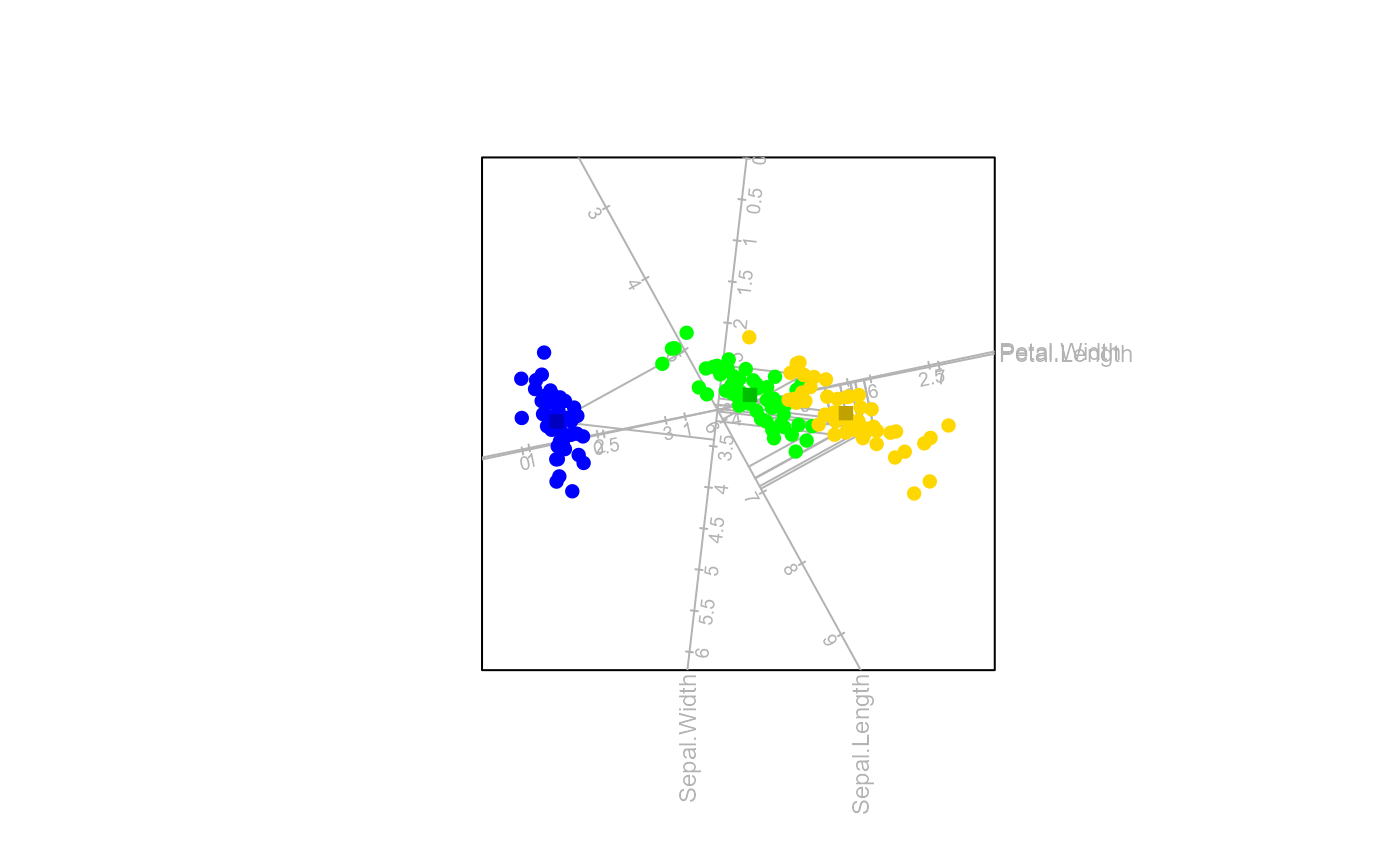
Predict samples to display on the biplot
prediction.RdThis function makes predictions of sample points, variables and means and displays them on the biplot.
Arguments
- bp
an object of class
biplotobtained from preceding functionbiplot().- predict.samples
a vector specifying which samples to predict.
- predict.means
a vector specifying which group means to predict.
- which
a vector specifying which variable to do the prediction.
Value
A list object called predict appended to the object of class biplot with the following elements:
- samples
a vector of indices of samples which are being predicted.
- predict.means
a vector of group names of groups for which the means are being predicted.
- which
the vector of indices variables which are being predicted.
- predict.mat
the matrix of predicted samples.
- predict.means.mat
the matrix of predicted group means.