Format aesthetics for the biplot samples
samples.RdThis function allows the user to format the aesthetics for the samples.
Usage
samples (bp,  which = 1:bp$g, col = ez.col, pch = 16, cex = 1,
label = FALSE, label.name = NULL, label.col=NULL, label.cex = 0.75,
label.side = "bottom", label.offset = 0.5,
connected=FALSE, connect.col = "black", connect.lty = 1,
connect.lwd = 1, opacity = 1)
Arguments
- bp
an object of class
biplot.- which
a vector containing the groups or classes for which the samples should be displayed, with default
bp$g.- col
the colour(s) for the samples, with default
blue.- pch
the plotting character(s) for the samples, with default
16.- cex
the character expansion(s) for the samples, with default
1.- label
a logical value indicating whether the samples should be labelled, with default
FALSE. Alternatively, specify"ggrepel"for non-overlapping placement of labels.- label.name
a vector of the same length as
whichwith label names for the samples, with defaultNULL. IfNULL, therownames(bp)are used. Alternatively, a custom vector of lengthnshould be used.- label.col
a vector of the same length as
whichwith label colours for the samples, with default as the same colour of the sample points.- label.cex
a vector of the same length as
whichwith label text expansions for the samples, with default0.75.- label.side
the side at which the label of the plotted point appears, with default
bottom. Note that unlike the argumentposintext(), options are "bottom", "left", "top", "right" and not1,2,3,4.- label.offset
the offset of the label from the plotted point. See
?textfor a detailed explanation of the argumentoffset.- connected
a logical value indicating whether samples are connected in order of rows of the data matrix, with default
FALSE.- connect.col
the colour of the connecting line, with default
black.- connect.lty
the line type of the connecting line, with default
1.- connect.lwd
the line width of the connecting line, with default
1.- opacity
the opacity level of the plotted points, with default
1for an opaque point.
Value
The object of class biplot will be appended with a list called samples containing the following elements:
- which
a vector containing the groups or classes for which the samples (and means) are displayed.
- col
the colour(s) of the samples.
- pch
the plotting character(s) of the samples.
- cex
the character expansion(s) of the plotting character(s) of the samples.
- label
a logical value indicating whether samples are labelled.
- label.name
the label names of the samples.
- label.col
the label colours of the samples.
- label.cex
the label text expansions of the samples.
- label.side
the side at which the label of the plotted point appears..
- label.offset
the offset of the label from the plotted point.
- connected
a logical value indicating whether samples are connected in order of the rows of the data matrix.
- connect.col
the colour of the connecting line.
- connect.lty
the line type of the connecting line.
- connect.lwd
the line width of the connecting line.
- opacity
the opacity level of the plotted points.
Details
The arguments which, col, pch and cex are based on the specification of group.aes or classes. If no groups are specified, a single colour, plotting character and / or character expansion is expected. If \(g\) groups are
specified, vectors of length \(g\) is expected, or values are recycled to length \(g\).
The arguments label, label.cex, label.side and label.offset are based on the sample size \(n\). A single value
will be recycled \(n\) times or a vector of length \(n\) is expected.
Examples
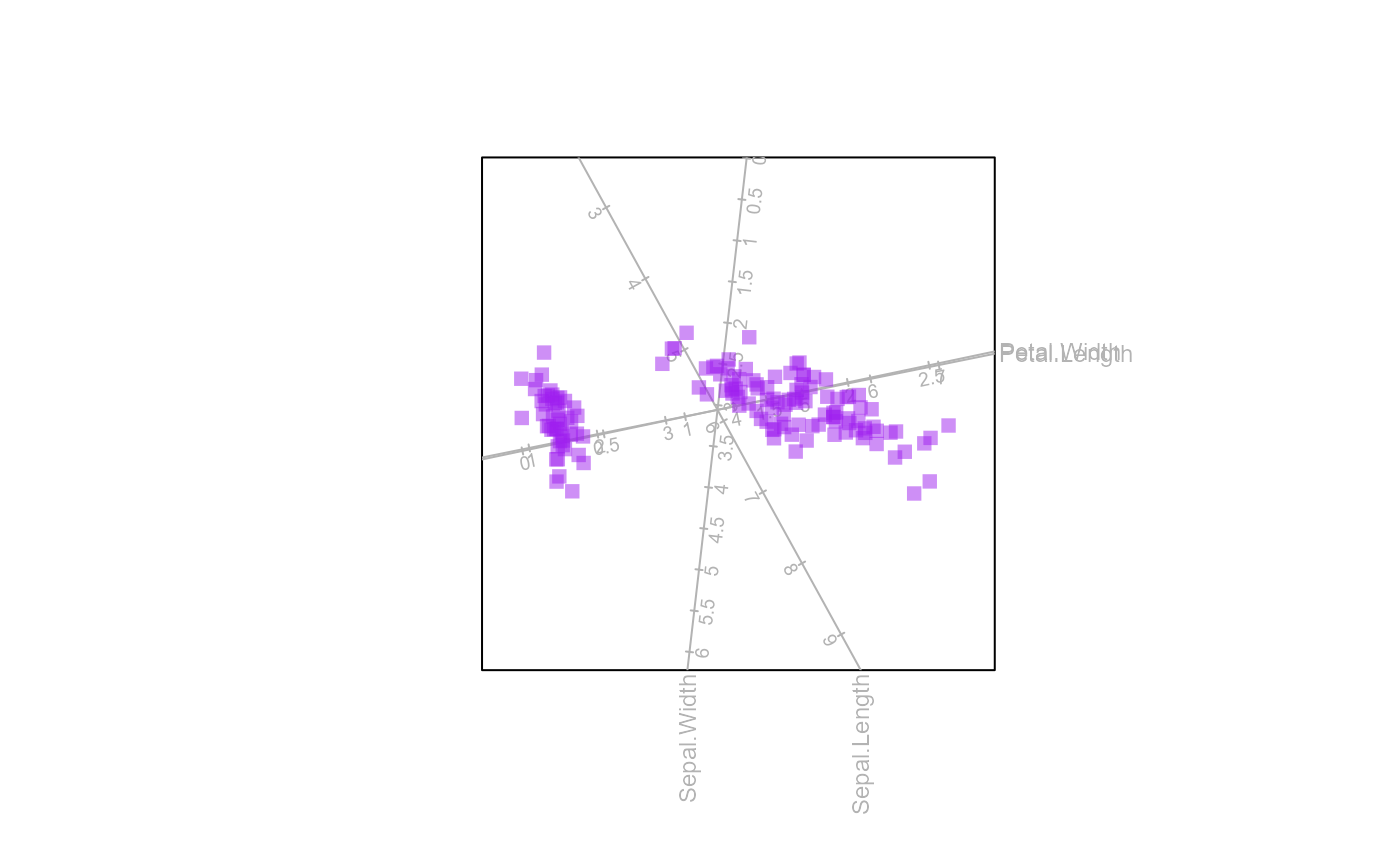
biplot(iris[,1:4]) |> PCA() |> samples(col="purple",pch=15, opacity=0.5) |> plot()
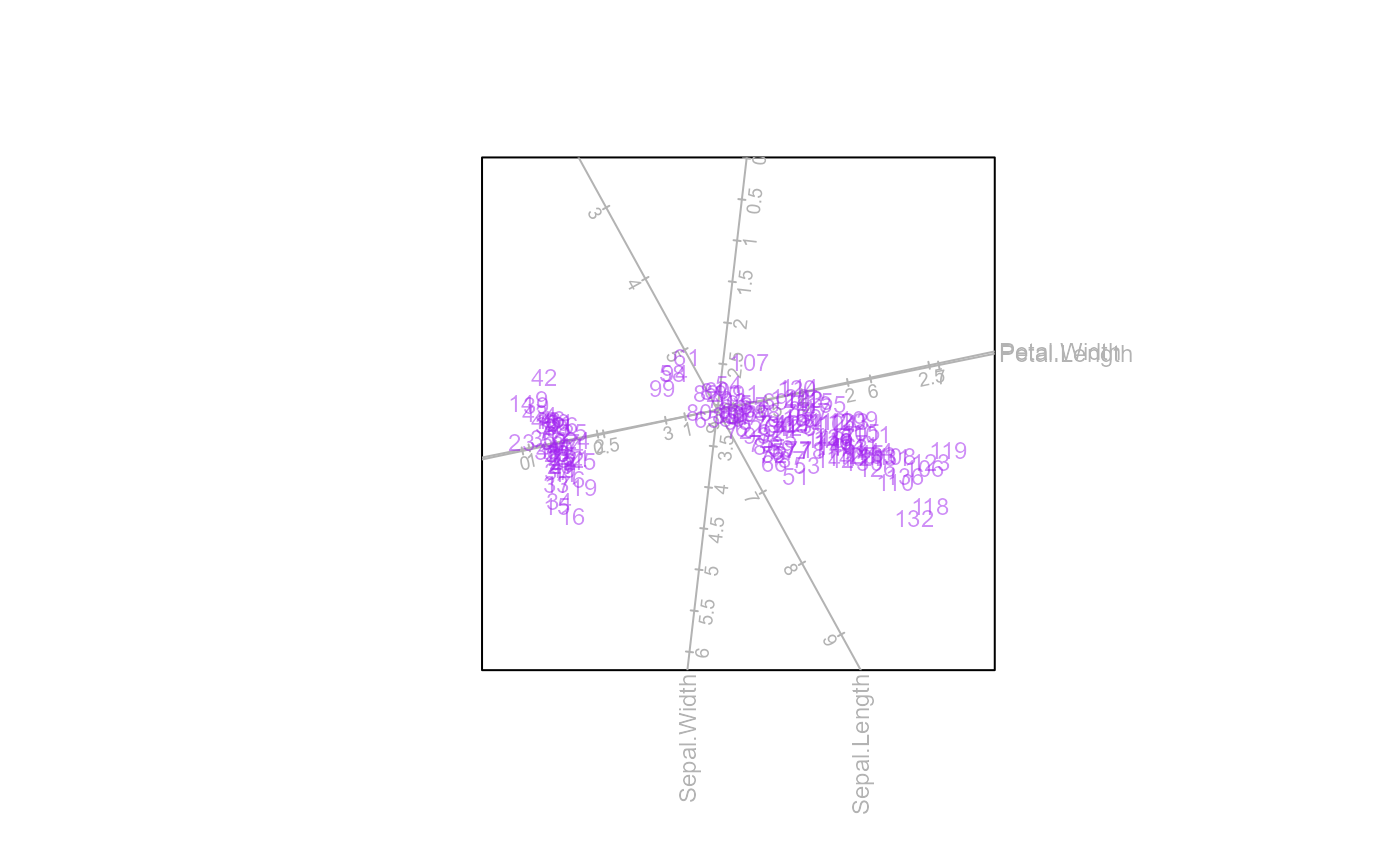
 biplot(iris[,1:4]) |> PCA() |>
samples(col="purple",pch=NA, opacity=0.5, label = TRUE) |> plot()
biplot(iris[,1:4]) |> PCA() |>
samples(col="purple",pch=NA, opacity=0.5, label = TRUE) |> plot()
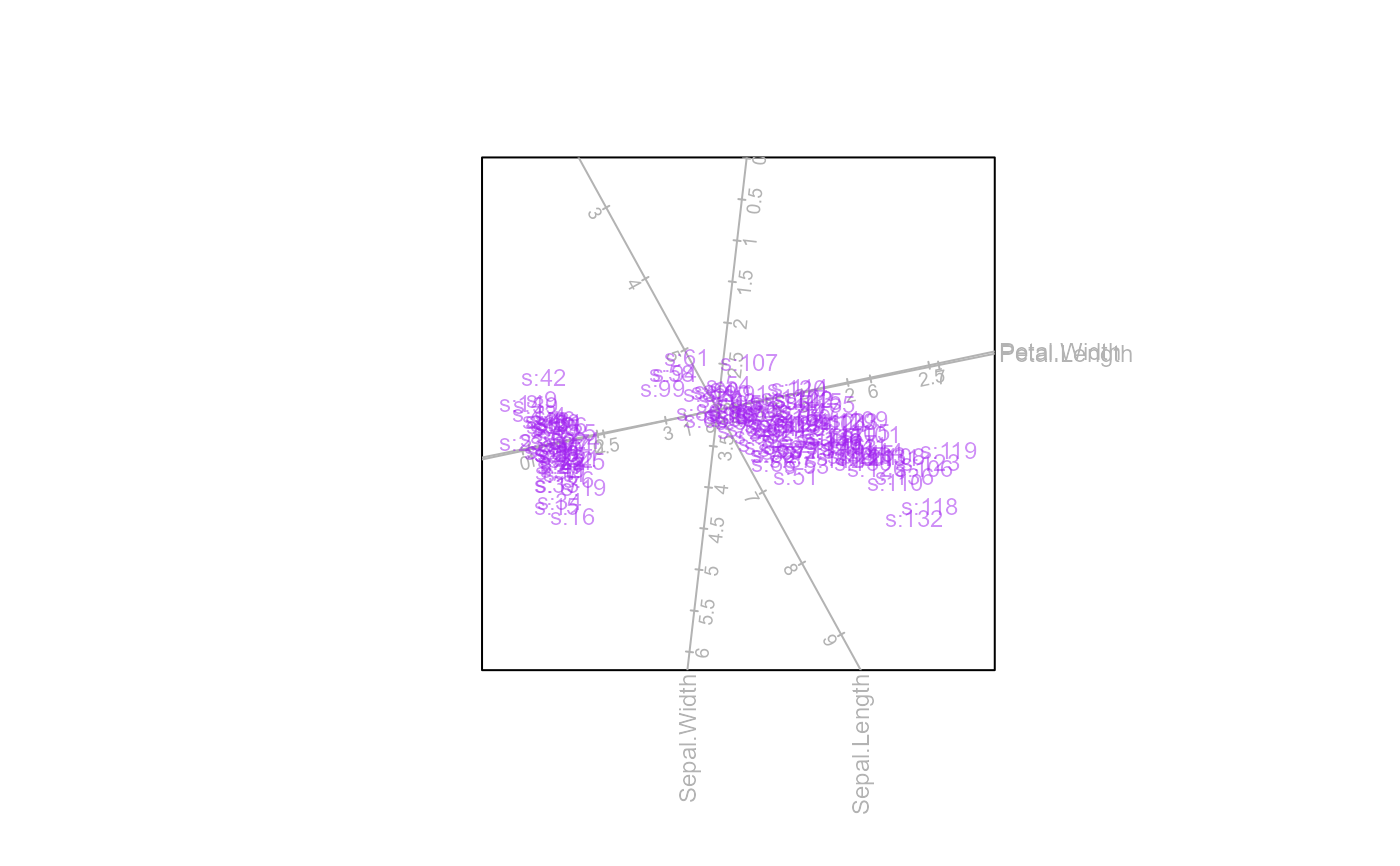
 biplot(iris[,1:4]) |> PCA() |>
samples(col="purple",pch=NA, opacity=0.5, label = TRUE,
label.name = paste("s:",1:150, sep="")) |>
plot()
biplot(iris[,1:4]) |> PCA() |>
samples(col="purple",pch=NA, opacity=0.5, label = TRUE,
label.name = paste("s:",1:150, sep="")) |>
plot()
 biplot(iris[,1:4]) |> PCA() |>
samples(col="purple",pch=NA, opacity=0.5, label = "ggrepel") |> plot()
#> Warning: Use of `df$x` is discouraged.
#> ℹ Use `x` instead.
#> Warning: Use of `df$y` is discouraged.
#> ℹ Use `y` instead.
#> Warning: Use of `df$z` is discouraged.
#> ℹ Use `z` instead.
#> Warning: Use of `df$x` is discouraged.
#> ℹ Use `x` instead.
#> Warning: Use of `df$y` is discouraged.
#> ℹ Use `y` instead.
#> Warning: Use of `df$z` is discouraged.
#> ℹ Use `z` instead.
#> Warning: Use of `df$x` is discouraged.
#> ℹ Use `x` instead.
#> Warning: Use of `df$y` is discouraged.
#> ℹ Use `y` instead.
#> Warning: Use of `df$z` is discouraged.
#> ℹ Use `z` instead.
#> Warning: Use of `df$x` is discouraged.
#> ℹ Use `x` instead.
#> Warning: Use of `df$y` is discouraged.
#> ℹ Use `y` instead.
#> Warning: Use of `df$z` is discouraged.
#> ℹ Use `z` instead.
#> Warning: Use of `df$x` is discouraged.
#> ℹ Use `x` instead.
#> Warning: Use of `df$y` is discouraged.
#> ℹ Use `y` instead.
#> Warning: Use of `df$z` is discouraged.
#> ℹ Use `z` instead.
#> Warning: Use of `df$x` is discouraged.
#> ℹ Use `x` instead.
#> Warning: Use of `df$y` is discouraged.
#> ℹ Use `y` instead.
#> Warning: Use of `df$z` is discouraged.
#> ℹ Use `z` instead.
#> Warning: ggrepel: 14 unlabeled data points (too many overlaps). Consider increasing max.overlaps
#> Warning: ggrepel: 14 unlabeled data points (too many overlaps). Consider increasing max.overlaps
biplot(iris[,1:4]) |> PCA() |>
samples(col="purple",pch=NA, opacity=0.5, label = "ggrepel") |> plot()
#> Warning: Use of `df$x` is discouraged.
#> ℹ Use `x` instead.
#> Warning: Use of `df$y` is discouraged.
#> ℹ Use `y` instead.
#> Warning: Use of `df$z` is discouraged.
#> ℹ Use `z` instead.
#> Warning: Use of `df$x` is discouraged.
#> ℹ Use `x` instead.
#> Warning: Use of `df$y` is discouraged.
#> ℹ Use `y` instead.
#> Warning: Use of `df$z` is discouraged.
#> ℹ Use `z` instead.
#> Warning: Use of `df$x` is discouraged.
#> ℹ Use `x` instead.
#> Warning: Use of `df$y` is discouraged.
#> ℹ Use `y` instead.
#> Warning: Use of `df$z` is discouraged.
#> ℹ Use `z` instead.
#> Warning: Use of `df$x` is discouraged.
#> ℹ Use `x` instead.
#> Warning: Use of `df$y` is discouraged.
#> ℹ Use `y` instead.
#> Warning: Use of `df$z` is discouraged.
#> ℹ Use `z` instead.
#> Warning: Use of `df$x` is discouraged.
#> ℹ Use `x` instead.
#> Warning: Use of `df$y` is discouraged.
#> ℹ Use `y` instead.
#> Warning: Use of `df$z` is discouraged.
#> ℹ Use `z` instead.
#> Warning: Use of `df$x` is discouraged.
#> ℹ Use `x` instead.
#> Warning: Use of `df$y` is discouraged.
#> ℹ Use `y` instead.
#> Warning: Use of `df$z` is discouraged.
#> ℹ Use `z` instead.
#> Warning: ggrepel: 14 unlabeled data points (too many overlaps). Consider increasing max.overlaps
#> Warning: ggrepel: 14 unlabeled data points (too many overlaps). Consider increasing max.overlaps
