Format aesthetics for the category level points
CLPs.RdThis function allows the user to format the aesthetics for the category level points (CLPs).
Usage
CLPs (bp, which = 1:ncol(bp$Xcat), col = "black", cex = 0.6)Value
The object of class biplot will be appended with a list called CLP.aes containing the following elements A list with the following components is available:
- which
a vector containing the columns or variables for which the CLPs are displayed.
- col
the colour(s) of the CLPs.
- cex
the character expansion(s) of the plotting characters of the CLPs.
Examples
mtdf <- as.data.frame(mtcars)
mtdf$cyl <- factor(mtdf$cyl)
mtdf$vs <- factor(mtdf$vs)
mtdf$am <- factor(mtdf$am)
mtdf$gear <- factor(mtdf$gear)
mtdf$carb <- factor(mtdf$carb)
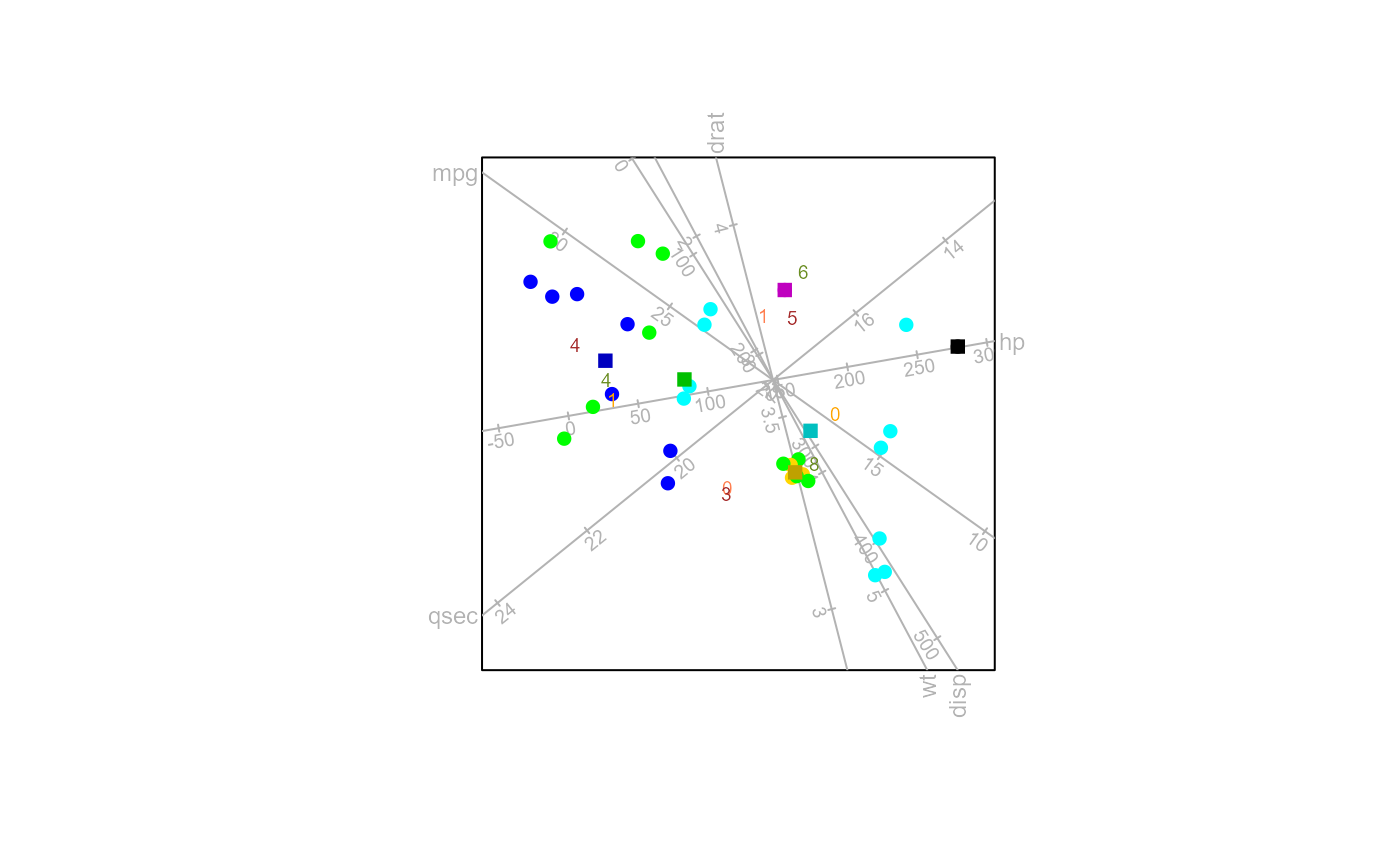
biplot(mtdf[,-11], scaled = TRUE) |> AoD(classes = mtdf[,11]) |>
CLPs(col = list(rep("olivedrab",3), rep("orange",2),
rep("coral",2), rep("brown",3))) |>
plot()