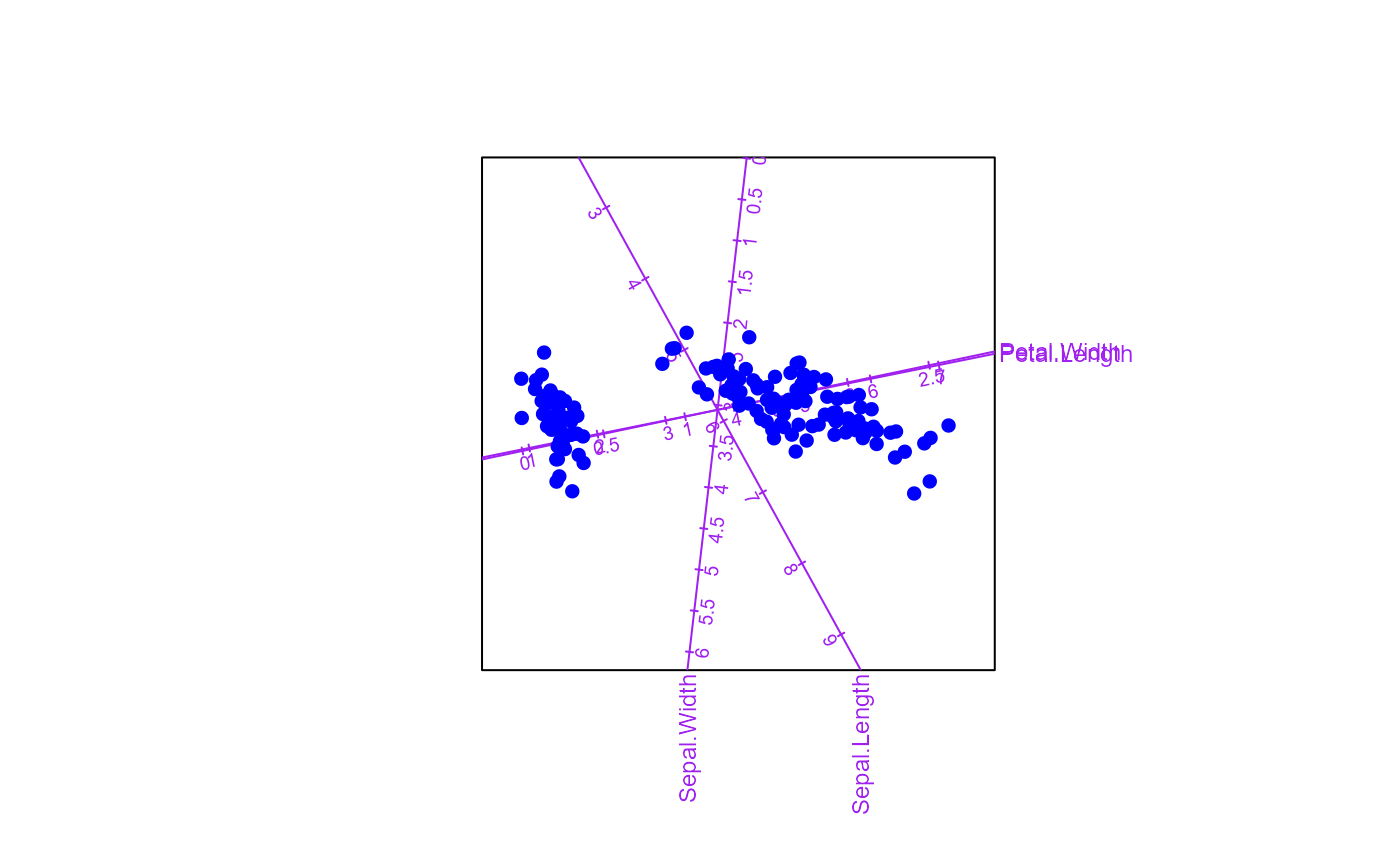
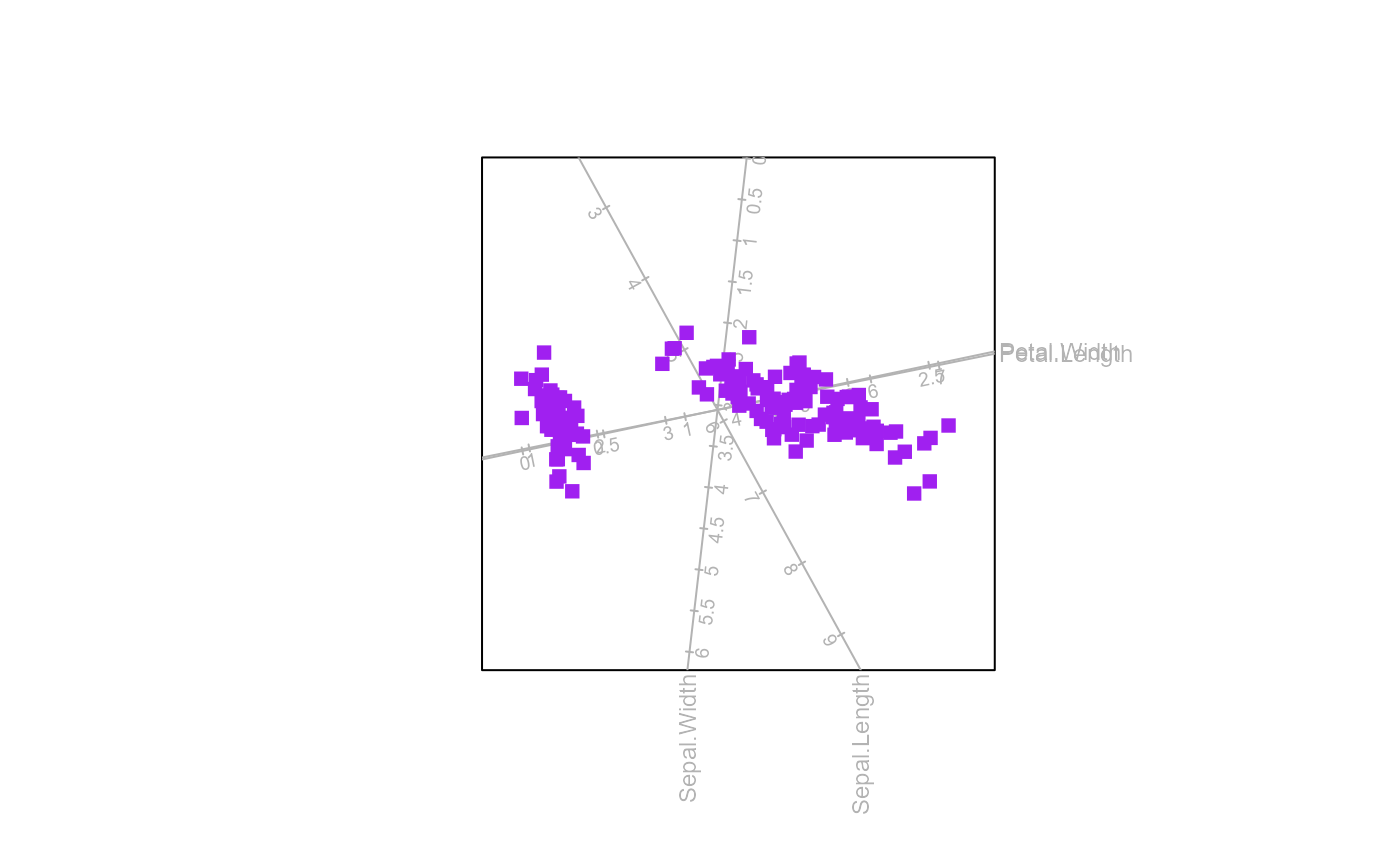
Format aesthetics for the biplot axes
axes.RdThis function allows the user to format the aesthetics for the biplot axes.
Usage
axes(bp, X.names=colnames(bp$X), which = 1:bp$p, col = grey(0.7), lwd = 1, lty = 1,
label.dir = "Orthog", label.col = col, label.cex = 0.75, label.line = 0.1,
label.offset=rep(0,4), ticks = 5, tick.col = col, tick.size = 1, tick.label = TRUE,
tick.label.side = "below", tick.label.col = tick.col, tick.label.cex = 0.6,
predict.col = col, predict.lwd = lwd, predict.lty = lty, ax.names = X.names,
orthogx = 0, orthogy = 0, vectors = FALSE, unit.circle=FALSE)
Arguments
- bp
an object of class
biplot.- X.names
a vector of column names of
bpto specify which axes should be labelled.- which
a vector containing the columns or variables for which the axes should be displayed, with default
1:p.- col
the colour(s) for the axes, with default
grey(0.7). Alternatively, provide a vector of colours corresponding toX.names.- lwd
the line width(s) for the axes, with default
1.- lty
the line type(s) for the axes, with default
1.- label.dir
a character string indicating the placement of the axis titles to the side of the figure. One of "
Orthog" for axis titles to appear orthogonal to the side of the figure (default) , "Hor" for axis titles to appear horizontally or "Paral" for axis titles to appear parallel to the side of the figure.- label.col
the colour(s) for the axis labels, with default,
col.- label.cex
the label expansion for the axis labels, with default
0.75.- label.line
the distance of the axis title from the side of the figure, with default
0.1.- label.offset
a four-component numeric vector controlling the distances axis titles are displayed from the side of the figure, with default
rep(0,4). Sides are numbered1to4according toRconventions.- ticks
an integer-valued vector indicating the number of tickmarks for each axis, with default
5for each axis.- tick.col
the colour(s) for the tick marks, with default
col.- tick.size
a vector specifying the sizes of tick marks for each axis, with default
1for each .- tick.label
a logical value indicating whether the axes should be labelled, with default
TRUE.- tick.label.side
a character string indicating the position of the tick label. One of "
below" for the label to appear below the tick mark (default) or "above" for the label to appear above the tick mark.- tick.label.col
the colour(s) for the tick mark labels, with default
tick.col.- tick.label.cex
the label expansion for the tick mark labels, with default
0.6.- predict.col
the colour(s) for the predicted samples, with default
col.- predict.lwd
the line width(s) for the predicted samples, with default
lwd.- predict.lty
the line type(s) for the predicted samples, with default
lty.- ax.names
a vector of size
pcontaining user defined titles for the axes.- orthogx
a numeric vector of size
pspecifying the x-coordinate of the parallel transformation of each axis, with default0for each axis. This is only used whendim.biplot = 2.- orthogy
a numeric vector of size
pspecifying the y-coordinate of the parallel transformation of each axis, with default0for each axis. This is only used whendim.biplot = 2.- vectors
a logical value indicating whether vector representation (calibrated axes) should be displayed on the biplot. This is only used when a PCA biplot is produced.
- unit.circle
a logical value indicating whether a unit circle should be displayed on the biplot.
Value
The object of class biplot will be appended with a list called axes containing the following elements:
- which
a vector containing the columns for which the axes are displayed.
- col
the colour(s) of the axes.
- lwd
the line width(s) of the axes.
- lty
the line type(s) of the axes.
- label.dir
the placement of the axis titles to the side of the figure.
- label.col
the colour(s) of the axis titles.
- label.cex
the label expansion(s) of the axis titles.
- label.line
the distance(s) of the axis titles from the side of the figure.
- ticks
the number of tick marks per axis.
- tick.col
the colour(s) of the tick marks.
- tick.size
the size(s) of the tick marks.
- tick.label
logical value(s) indicating whether axes are labelled.
- tick.label.side
the position of the tick mark labels.
- tick.label.col
the colour(s) of the tick mark labels.
- tick.label.cex
the expansion(s) of the tick mark labels.
- predict.col
the colour(s) of the predicted samples.
- predict.lty
the line type(s) of the predicted samples.
- predict.lwd
the line width(s) of the predicted samples.
- names
the user defined axis titles.
- orthogx
the horizontal translations for each axis.
- orthogy
the vertical translations for each axis.
- vectors
a logical value indicating whether calibrated axes are plotted.