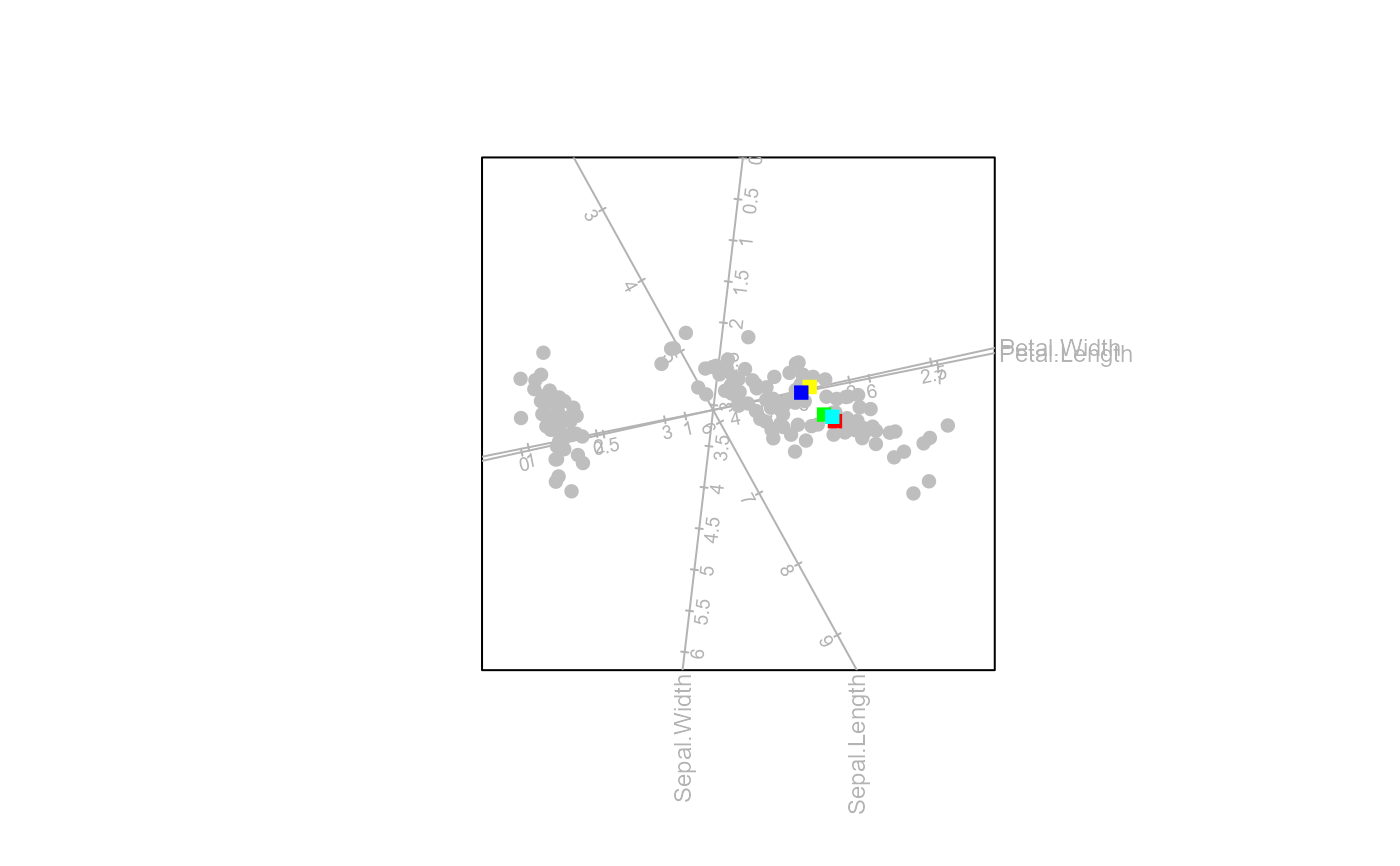
Format aesthetics for the supplementary (new) biplot samples
newsamples.RdThis function allows formatting changes to new samples.
Usage
newsamples (bp,  col = "darkorange1", pch = 1, cex = 1, label = FALSE,
label.name = NULL, label.col = NULL,label.cex = 0.75, label.side = "bottom",
label.offset = 0.5, connected = FALSE, connect.col = "black", connect.lty=1,
connect.lwd=1)
Arguments
- bp
an object of class
biplot.- col
the colour(s) for the new samples, with default
darkorange1.- pch
the plotting character(s) for the new samples, with default
1.- cex
the character expansion(s) for the new samples, with default
1.- label
a logical value indicating whether new samples should be labelled or not, with default
FALSE.- label.name
the label names for the new samples.
- label.col
a vector of the same length as the number of new samples containing the colour(s) for the labels of the new samples, with default the colour of the sample points.
- label.cex
the label text expansion(s) for the new samples, with default
0.75.- label.side
the side at which the label of the plotted point appears, with default
bottom. Note that unlike the argumentposintext(), options are "bottom", "left", "top","right" and not1,2,3,4.- label.offset
the offset of the label from the plotted point. See
?textfor a detailed explanation of the argumentoffset.- connected
a logical value indicating whether samples are connected in order of rows of the data matrix, with default
FALSE.- connect.col
the colour of the connecting line, with default
black.- connect.lty
the line type of the connecting line, with default
1.- connect.lwd
the line width of the connecting line, with default
1.
Value
The object of class biplot will be appended with a list called newsamples containing the following elements:
- col
the colour(s) of the new samples.
- pch
the plotting character(s) of the new samples.
- cex
the character expansion(s) of the plotting character(s) of the new samples.
- label
a logical value indicating whether new samples are labelled.
- label.col
the label colours of the new samples.
- label.cex
the label text expansions of the new samples.
- label.side
the side at which the label of the plotted point appears.
- label.offset
the offset of the label from the plotted point.
- connected
a logical value indicating whether new samples are connected.
- connect.col
the colour of the connecting line.
- connect.lty
the line type of the connecting line.
- connect.lwd
the line width of the connecting line.
